Question 3: Log Triage
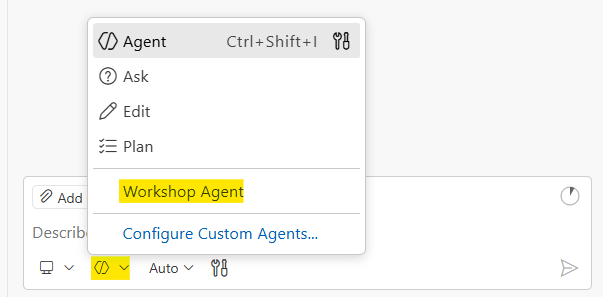
Before you start: Make sure you’ve selected the Workshop Agent in GitHub Copilot Chat. Open QUESTION-3-START-HERE.md in the question-3-log-triage folder and keep it open while you work. This loads the AI context GitHub Copilot needs to help you effectively.
Scenario
You’re an on-call engineer at 2 AM. The alerting system is blowing up: users are seeing 503 errors, payments are failing, and the dashboard is red. The symptoms are obvious. Everyone can see the system is down.
But your real job isn’t to describe the symptoms. It’s to figure out what actually caused this. The logs tell a story. Errors don’t happen in isolation. Something broke first, and that caused a cascade of failures across the system. Your job is to find the thing that broke first, the root cause beneath the noise.
Problem Statement
Write a script that:
- Reads all
.logfiles from thequestion-3-log-triage/logs/directory - Extracts all error codes matching the pattern
Efollowed by 4 digits (e.g.,E1002,E2002) - Only counts ERROR level entries (not WARN or INFO)
- Counts occurrences of each error code across all files
- Identifies the root cause (which error started the cascade?)
- Writes a triage report to
reports/triage-report.txt
Report Requirements
The first line of your report must be an executive summary: one professional sentence explaining what is wrong with the system right now and why. This is the line your manager reads at 2 AM. Make it count.
The rest of the report should include technical details: error codes sorted by frequency, which files they appeared in, timeline information, whatever helps someone fix the problem fast.
Log Format
Each log file contains entries in this format:
[YYYY-MM-DD HH:MM] LEVEL CODE: message text
Example lines:
[2026-02-06 02:09] ERROR E1002: Database connection pool exhausted on db-primary, cannot acquire connection (0 of 20 available)
[2026-02-06 02:07] WARN W1001: Database connection pool running low on db-primary, 3 of 20 connections available
[2026-02-06 02:10] ERROR E2002: Payment processing failed for user=156 amount=250.00 reason=database_connection_unavailable
[2026-02-06 02:02] INFO I0002: Health check passed, all services operational
Only count entries with level ERROR. Ignore WARN and INFO entries.
Expected Output Format
Your report file (reports/triage-report.txt) should look something like this:
Database connection pool exhaustion on db-primary caused cascading failures across all services, resulting in payment processing errors, order failures, and complete gateway outage.

================================================================================
                              LOG TRIAGE REPORT
================================================================================
Scanned: 3 files | Found: 41 errors | Time range: 02:09 - 02:24

ROOT CAUSE
   E1002: Database connection pool exhausted (8 hits, first seen 02:09)

ALL ERRORS BY FREQUENCY
--------------------------------------------------------------------------------
   E2002  ############  12 hits  (29%)  Payment processing failed
   E1002  ########       8 hits  (20%)  Database connection pool exhausted
   E2001  ######         6 hits  (15%)  Query timeout
   E3001  ######         6 hits  (15%)  Upstream timeout
   E2003  ####           4 hits  (10%)  Order processing failed
   E3003  ###            3 hits  ( 7%)  No healthy upstream servers available
   E3002  ##             2 hits  ( 5%)  Circuit breaker tripped

ERRORS BY SOURCE
--------------------------------------------------------------------------------
   app-server-1.log: 18 errors
   app-server-2.log: 12 errors
   api-gateway.log:  11 errors
================================================================================
The exact format can vary. Use your creativity and ask AI to help you make it scannable and clear. The executive summary on line 1 and the root cause identification are the important parts.
Sample Files
The question-3-log-triage/logs/ directory contains sample log files:
app-server-1.log— Application server logsapp-server-2.log— Second application serverapi-gateway.log— API gateway logs
These files simulate a real incident with cascading failures across services. The errors are connected. Read the timestamps carefully.
Workshop Workflow
1. Plan
Understand the problem before diving in. Think about edge cases:
- Should I handle nested directories or just the top level?
- What if a log line has multiple error codes?
- Should I include the source file in my output?
- What if there are no error codes found?
- How do I tell the difference between symptoms and root cause?
Then break the problem into steps:
- Find all .log files in the directory
- Read each file line by line
- Filter for ERROR level entries only
- Use regex to extract error codes
- Aggregate counts in a dictionary
- Look at timestamps to find what broke first
- Write the report to
reports/triage-report.txt
2. Prove
Direct AI to write your solution in the starter file. Before running anything, predict what the output will look like. Then run:
./test_triage.ps1
The test checks that your report exists, has an executive summary, references multiple error codes, and identifies the root cause, not just the most frequent error.
3. Explain
Walk through your script: how it parses each line, why it filters by ERROR level, how you identified the root cause vs. the symptoms, and how the output helps someone at 2 AM triage an incident.
Deliverables
Your solution goes in triage.ps1 in the question-3-log-triage/ folder. Open that file and write your code there. The variables $LogsDir and $ReportFile are already set up for you.
Run with:
./triage.ps1
Test with:
./test_triage.ps1
Extension Challenges
If you finish early:
- Timeline view — Show the cascade: what error appeared first, what followed, and when
- Correlation analysis — Group related error codes that always appear together
- Make it a CLI — Accept the directory path as a command-line argument
Hints
Only look at hints if you’re stuck!